
Energy share
Turbomachinery is the core energy consumer in air separation plants — small efficiency shifts flow straight into annual operating cost.
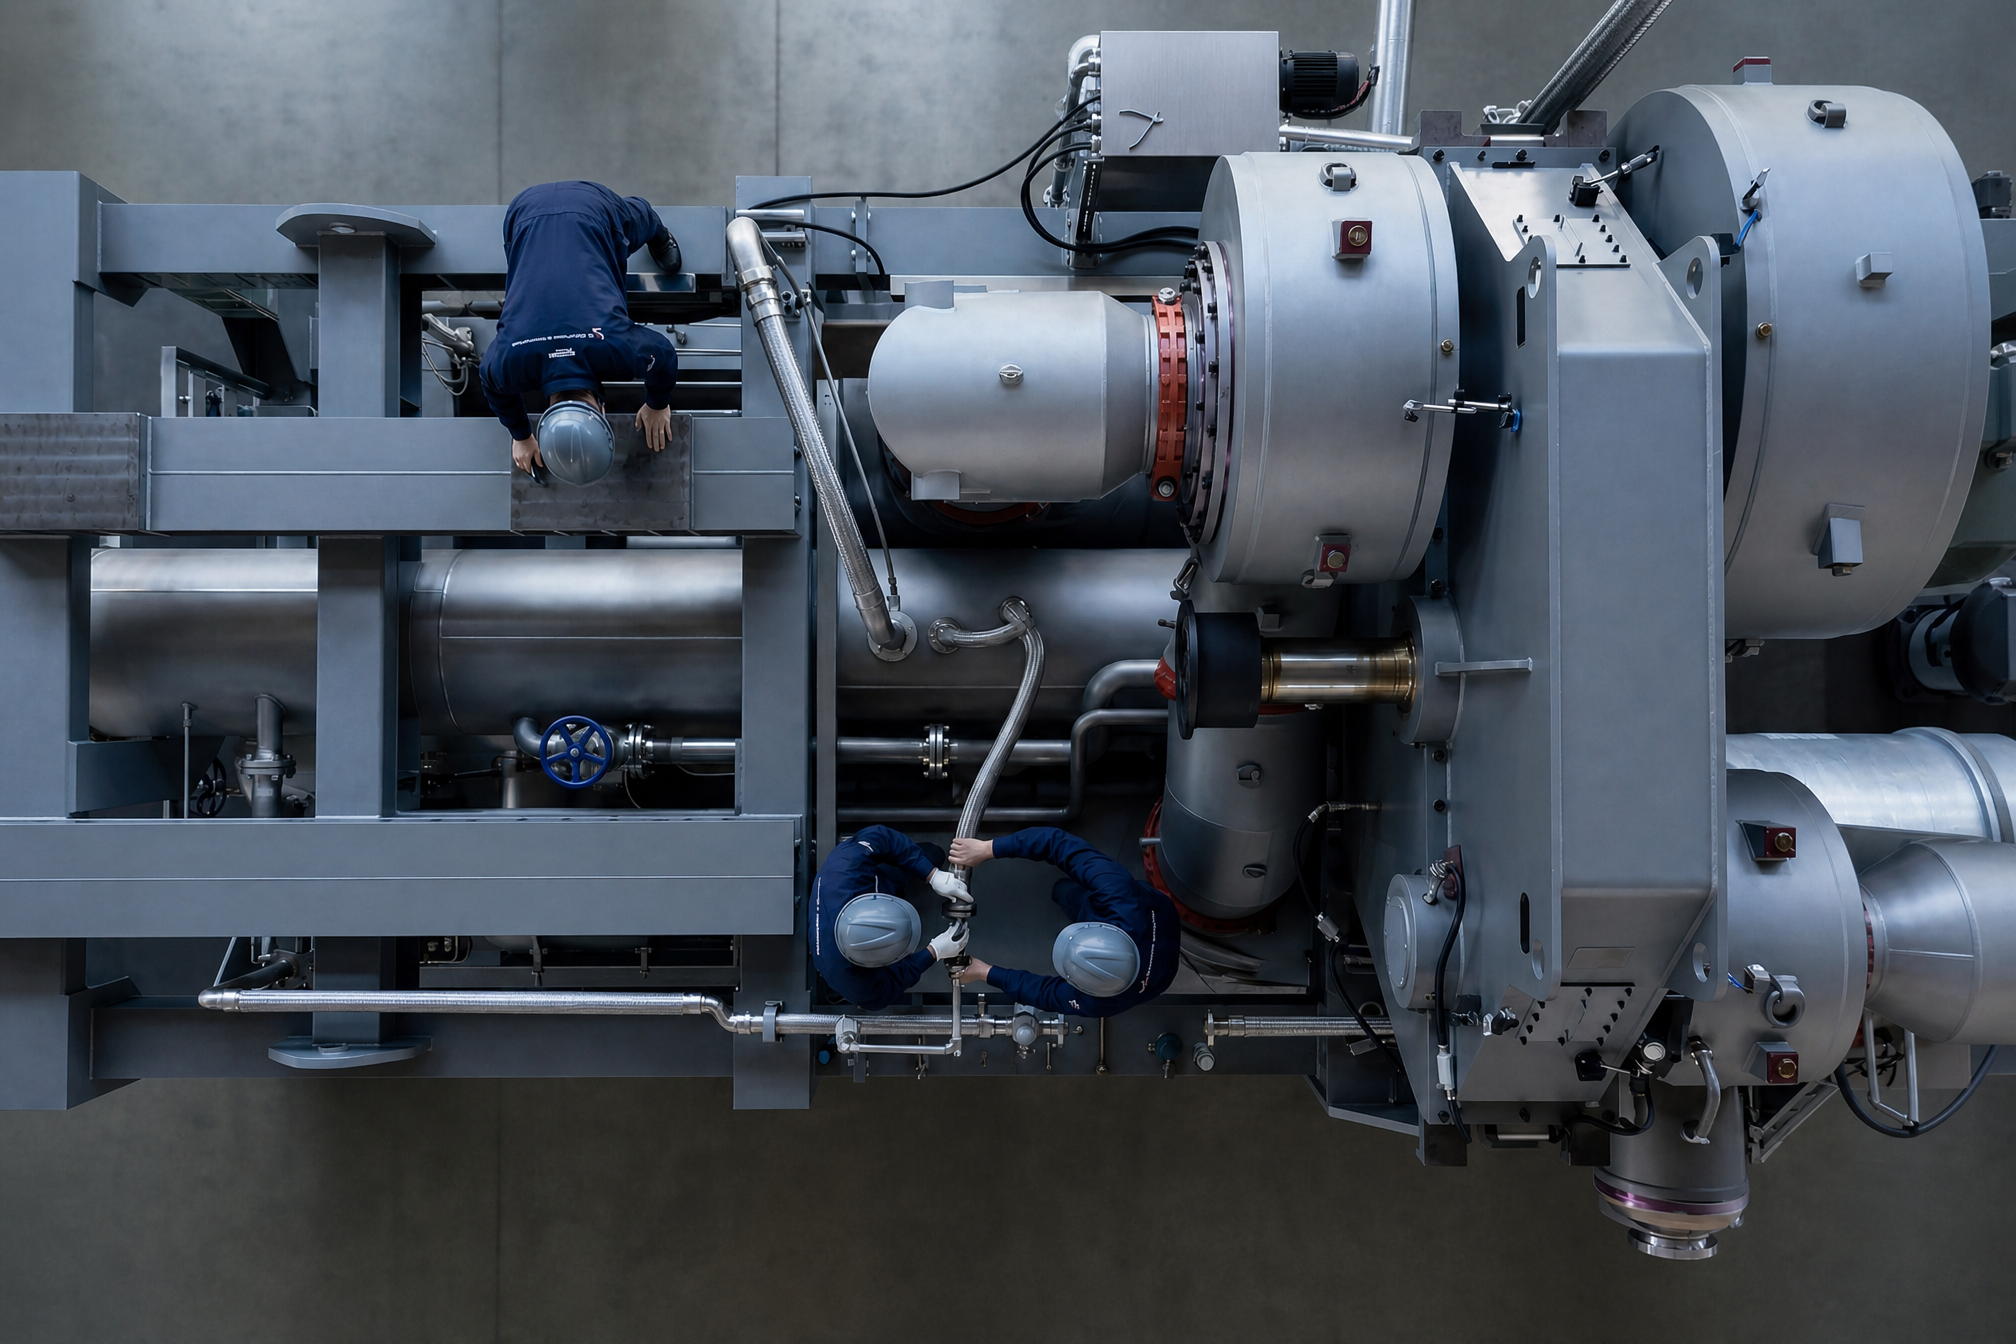
Restore every compressor to peak efficiency
When air separation and process gas compressors drift from design conditions, losses compound with electricity rates, steam prices, and annual run hours. Energy retrofits calibrate the entire train — not just a single component.
Turbomachinery is the core energy consumer in air separation plants — small efficiency shifts flow straight into annual operating cost.
After years of service, flow paths, seals, heat exchange, and controls on legacy compressors typically fall below optimal performance.
Electricity and steam prices keep climbing — inefficient equipment becomes a margin drain.
Tighter energy and emissions targets push aging units from "running" to running efficiently.
From full unit replacement to auxiliary fine-tuning — matched to your investment level and savings target
For legacy trains with severe efficiency loss where operating cost already exceeds the lifecycle cost of a new unit.
When process changes reduce main compressor efficiency but foundations, drivers, and system boundaries remain usable.
For persistent small losses from aging heat exchange, seals, drainage, and resistance systems.
Break efficiency loss down to each component · actual vs. design conditions
Every deviation is validated against field data and design conditions — retrofit scope defined at component level.
Calculations based on ¥0.6/kWh or ¥150/ton steam at 8,000 hours/year. Every figure traces to documented field conditions.
18.5%
25%
18.5%
17.5%
17%
13%